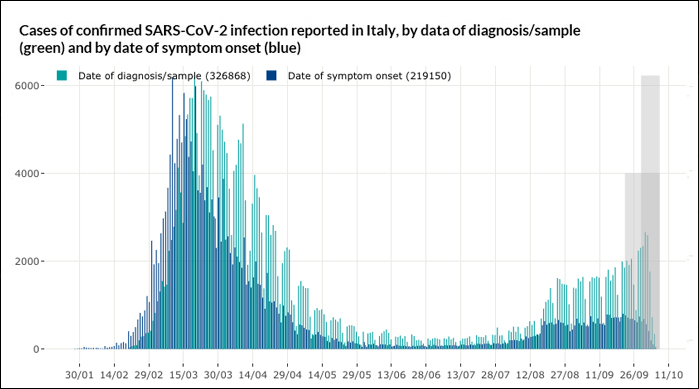
The number of diagnosed cases and outbreaks of Covid-19 in Italy continues to increase. It remains essential for the population to maintain behaviours that reduce the risk of transmission (distance, hand washing, mask, avoid gatherings) in all contexts.
Key Points
- The report provides an analysis of data referring to the period September 21-27, 2020. Due to the time between exposure to the pathogen and the development of symptoms, and between these and the diagnosis and subsequent notification, many of the cases reported this week are likely to have become infected at the beginning of September. Some of the cases identified by screening, however, may have contracted the infection in earlier periods.
- The virus now circulates throughout the country. An increase is confirmed in the new cases reported in Italy for the ninth consecutive week, with a cumulative incidence (ISS flow data) in the last 14 days of 34.2 per 100 thousand inhabitants (period 14/9-27/9), (compared to 31.4 per 100 thousand inhabitants in the period 7/9-20/9). This week there has been a slight increase in the median age of the cases (42 years vs. 41 years in the previous week).
- There are eight Regions/PPAA that reported an increase in the number of diagnosed cases, compared to the previous week (ISS flow). This week the percentage of new cases imported from abroad continues to drop (5.7% vs 8% last week) and from other Regions/PAA (1.7% vs 3.3% the previous week). The percentage of cases detected through contact tracing activities remained stable (35.8% of new cases) and there was a slight increase in the percentage of cases detected through screening activities (28.2% vs. 27.6% the previous week). 29.6% of cases were identified through the appearance of symptoms and in 6.5% of cases, no diagnostic findings were reported.
- In the period September 10-23, 2020, the Rt calculated on symptomatic cases was 1.01 (95%CI: 0.88 – 1.08). There are 12 Regions/PPAA where the Rt has been higher than 1 this week, seven of which have a credibility range that does not include one.
- For any details on the methods of calculation and interpretation of the Rt reported, please refer to the in-depth analysis available on the website of the Higher Institute of Health.
- However, the national transmission index must be interpreted with caution at this particular time of the epidemic. In fact, the Rt calculated on symptomatic cases, while remaining the most reliable indicator at regional level and comparable over time for monitoring transmissibility, could slightly underestimate the actual transmission of the virus at national level. Therefore, the national Rt should always be interpreted taking into account the incidence figure.
- A total of 3,266 active outbreaks were reported, of which 909 are new (the adopted definition of outbreak foresees the identification of 2 or more positive cases linked to each other). Both are increasing for the ninth consecutive week (in the previous week of monitoring, 2,868 active outbreaks were reported, of which 832 new). Outbreaks were reported in almost all provinces (101/107). Despite the increase in active outbreaks, the Regions/PPAA reported 3,026 new cases not associated with known transmission chains (+13.7% compared to the previous week). In terms of the transmission context, the percentage of outbreaks that occurred in the family environment remained stable (76.5% of all active outbreaks compared to 76.1% the previous week). The percentage of outbreaks occurring in the working environment increased (7.2% vs. 5.6% last week) and the percentage of outbreaks associated with recreational activities decreased (4.5% vs. 6.3% the previous week).
- This week, 14 outbreaks were also reported where transmission could have taken place in schools, although it is currently not always confirmed. The impact of the outbreaks in schools will be better assessed over the coming weeks.
- On a national level, the number of hospitalised people continues to rise (2846 vs. 2365 in the medical area, 254 vs. 222 in intensive care on 27/9 and 20/9, respectively) and, consequently, employment rates in the medical area and in intensive care are increasing.
Fonte Salute.gov.it News
